

Image Details
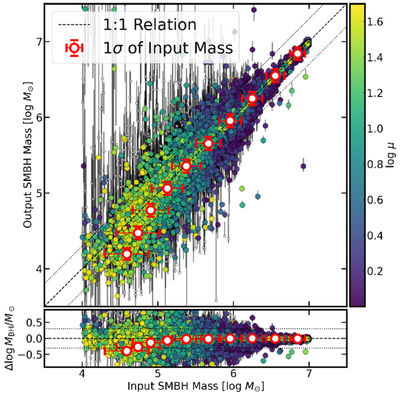
Caption: Figure A3.
Accuracy of our BH mass measurement. Top: output BH masses compared to the input BH masses. Bottom: the difference between output and input BH masses (﹩{\rm{\Delta }}\mathrm{log}{M}_{{\rm{BH}}}=\mathrm{log}{M}_{{\rm{BH}},{\rm{output}}}-\mathrm{log}{M}_{{\rm{BH}},{\rm{input}}}﹩) compared to the input BH masses. Colored data points denote sources with SNRHα,broad > 5 while gray circles represent those with lower SNR. The color of each data point denotes the input magnification for our sources. The circles represent the mean values of data points in each 0.3 dex bin of the output MBH. The black dashed line denotes the 1:1 line, and the black dotted lines represent 0.3 dex.
Other Images in This Article
Show More
Copyright and Terms & Conditions
© 2026. The Author(s). Published by the American Astronomical Society.

