

Image Details
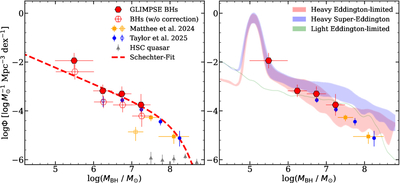
Caption: Figure 7.
BHMF derived from this study. Left: the measured BHMF and the empirical relation. Our sources are shown as red hexagons, where filled hexagons denote the analysis applying the completeness correction and open hexagons do not. Previous studies are shown as blue circles and yellow squares (J. Matthee et al. 2024; A. J. Taylor et al. 2025), where open symbols denote the data points with high incompleteness in their analysis. The gray triangles represent the BHs' number density calculated from quasars at z ∼ 4 from HSC observations (W. He et al. 2024). Our fitting using the Schechter function is shown as the red-dashed line. Right: comparison between our measurement and a recent theoretical prediction including heavy seeds. The blue- and red-shaded regions denote the BHMF from SAM predictions for the heavy seeds model, while the green shaded region represents the BHMF from the light seeds model (J. Jeon et al. 2025).
Other Images in This Article
Show More
Copyright and Terms & Conditions
© 2026. The Author(s). Published by the American Astronomical Society.

