

Image Details
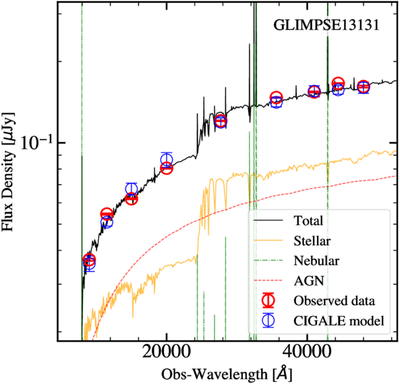
Caption: Figure 3.
Example of the best-fit galaxy and AGN composite SED of our sample, ID13131. The red data points represent the flux measured from JWST/NIRCam images, and the blue data points represent the model value. The black solid line represents the best-fit spectrum from CIGALE. The yellow solid line, green dashed–dotted line, and red-dashed line represent the stellar emission, the nebular emission, and the AGN contribution, respectively.
Other Images in This Article
Show More
Copyright and Terms & Conditions
© 2026. The Author(s). Published by the American Astronomical Society.

Copyright ©
2026 Astronomy Image Explorer. All Rights Reserved.
