Image Details
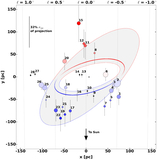
Caption: Figure 8.
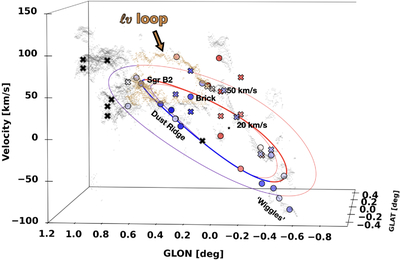
The output of the orbital modeling is determined by fitting the clouds in PPV space, as well as their NF posteriors from the PPDFs. This figure shows the best-fitting orbits and clouds on top of the spectral decomposition of MOPRA HNCO data from J. D. Henshaw et al. (2016b; gray background points). The median ellipse is shown as a thicker line compared to the inner and outer extents. We highlight a closed loop of gas, colored with gold points, referred to here as the “ℓv loop,” which may be indicative of shearing or disruption events causing gas to deviate from the orbital streams. Markers are the same as presented in Figure 5. Blue and red colors indicate likely near or far positions, respectively. The black star denotes the position of SgrA⋆.
Other Images in This Article
Show More
Copyright and Terms & Conditions
© 2026. The Author(s). Published by the American Astronomical Society.