Image Details
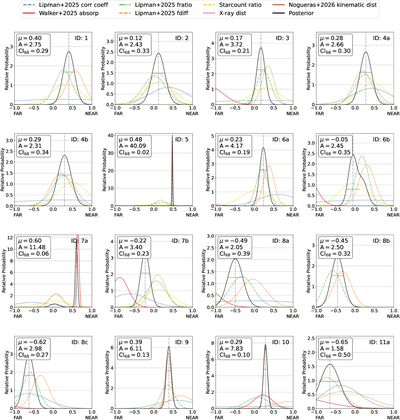
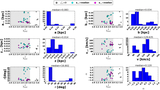
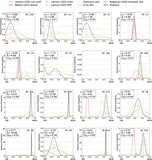
Caption: Figure B1.
Prior and posterior PPDFs for all cloud masks in the catalog. Each panel shows priors for different methods as colored lines, and the posterior is indicated by a black solid line. We report the location of the peak (μ, vertical gray dashed–dotted line), the relative probability peak (A), and the 68% confidence interval (CI68, horizontal solid gray line), which are used to obtain a posterior PPDF distribution used for the orbital fitting procedure in Section 3.2.
Other Images in This Article
Show More
Copyright and Terms & Conditions
© 2026. The Author(s). Published by the American Astronomical Society.
Copyright ©
2026 Astronomy Image Explorer. All Rights Reserved.