Image Details
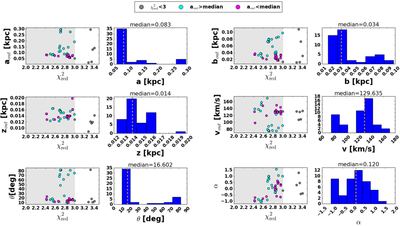
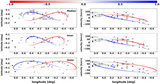
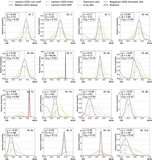
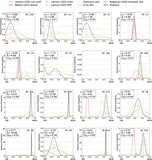
Caption: Figure 4.
Left-hand panels show ﹩{\chi }_{{\rm{red}}}^{2}﹩ values for output parameter values from the parameter grid search. The gray shaded region covers the ﹩{\chi }_{{\rm{red}}}^{2}﹩ range 1 < ﹩{\chi }_{{\rm{red}}}^{2}﹩ < 3 where the majority of outputs converge. Cyan (magenta) points correspond to outputs for ellipses with a major axis greater (less) than the median aout value. Gray points note output values with ﹩{\chi }_{{\rm{red}}}^{2}﹩ > 3, indicating poor fits, which are excluded from the histograms. Right-hand panels show histogram distributions of the output parameter values that lie within the gray shaded region from the left panel plots, along with the median output value (gold dotted line).
Other Images in This Article
Show More
Copyright and Terms & Conditions
© 2026. The Author(s). Published by the American Astronomical Society.