Image Details
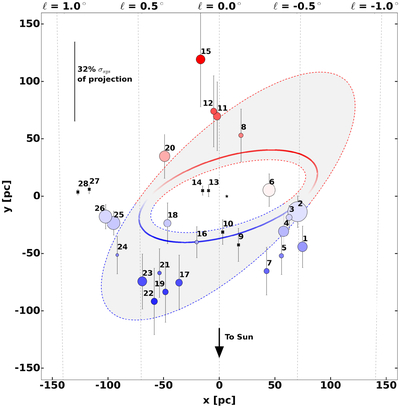
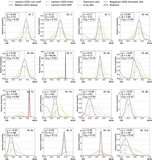
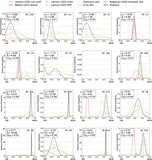
Caption: Figure 6.
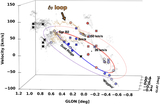
We present a preliminary top-down view of the best-fitting CMZ orbits, as well as projected positions of all cataloged molecular clouds based on the outer ellipse model from the parameter grid search. The above figure shows a top-down projection of the orbits summarized in Table 3. The middle ellipse corresponds to the median x2 orbit from the parameter grid search. The gray shaded region is bound by the best-fit inner and outer extents and indicates a range of possible x2 orbits. Blue and red colors indicate more likely near or far side positions, respectively. Positions of CMZ clouds that were included in the x2 fitting are denoted by circular markers, with colors corresponding to the location of the Gaussian peak in the posterior PPDF for each cloud and sizes corresponding to the effective radius of each cloud as reported in D. L. Walker et al. (2025). Black “x” markers denote clouds that were not incorporated in the x2 fitting. Error bars correspond to the uncertainties of the projected positions calculated using the PPDF CI68 values and standard deviation in the projected distances on all three ellipses for each cloud. A 32% systematic error bar for the LOS distance projections is shown in the top left. The black star denotes the location of SgrA⋆.
Other Images in This Article
Show More
Copyright and Terms & Conditions
© 2026. The Author(s). Published by the American Astronomical Society.