Image Details
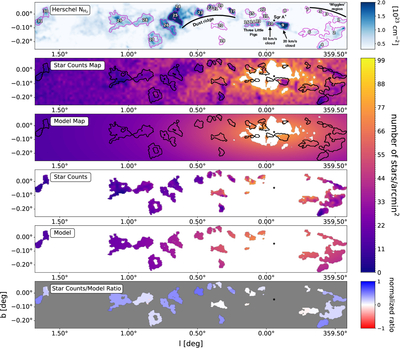
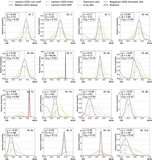
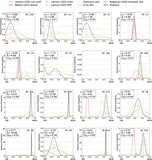
Caption: Figure 2.
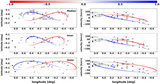
Stellar density maps of the CMZ show dark extinction features that can be used to calculate a star count ratio to determine NF positions of molecular clouds in the catalog. From top to bottom, the panels show: (i) Herschel column density map with black contours and ID numbers correspond to cloud masks summarized in Table 1, (ii) stellar density map from S. Nishiyama et al. (2013), and (iii) modeled star count map from E. Gallego-Cano et al. (2020), both of which we convolve and regrid to match the 36″ Herschel column density map. White areas are masked pixels where the star count is greater than the maximum of the model. Panel (iv) is a cutout of star counts for the molecular clouds; panel (v) is a cutout of modeled star counts; and panel (vi) is a ratio of the star counts to the model map. The blue and red color scales denote more likely near or far side positions, respectively. Clouds containing >20% of masked pixels are excluded from analysis. The black star indicates the location of SgrA⋆.
Other Images in This Article
Show More
Copyright and Terms & Conditions
© 2026. The Author(s). Published by the American Astronomical Society.