Image Details
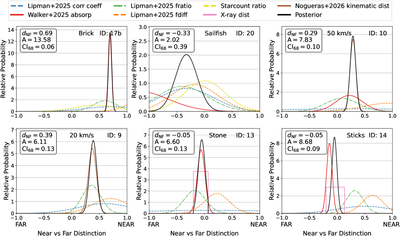
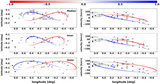
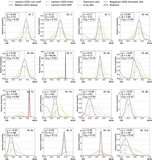
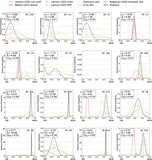
Caption: Figure 3.
The methods used to infer NF positions of individual clouds in the CMZ can be combined in a Bayesian framework to create a posterior distribution of NF likely positions for a given cloud on a normalized scale of −1 (far) to +1 (near). The flux difference (orange dashed line) is used as a likelihood function, and is multiplied by distributions for the flux ratio (green), correlation coefficient (blue), absorption fraction (red), and star count ratios (yellow). A handful of clouds have prior data from X-rays (pink), or stellar kinematics (brown). After taking the product of the priors, we report the location of the peak (μ), the relative probability peak (A), and the 68% confidence interval (CI68), which are used to obtain a positional PDF posterior distribution (PPDF; black solid line). The peak of the posterior indicates the most likely NF position of the cloud. All distributions are normalized to unit integral probability.
Other Images in This Article
Show More
Copyright and Terms & Conditions
© 2026. The Author(s). Published by the American Astronomical Society.