Image Details
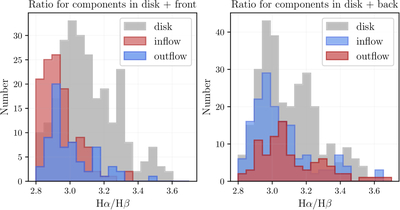
Caption: Figure 6.
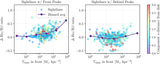
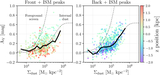
Left: the distribution of Balmer ratios between different components in the ISM and front of the galaxy. Red denotes inflow (redshifted components in front of the galaxy) and blue denotes outflow. Both inflow and outflow peak at lower ratios than the disk. Right: a histogram showing the ratios of different components in the ISM and behind the galaxy. In this case, blue represents inflow (blueshifted components behind the galaxy), and red represents outflow. Inflow peaks at a similar ratio to the disk, while outflow peaks at a ratio higher than the disk.
Other Images in This Article

Copyright and Terms & Conditions
© 2026. The Author(s). Published by the American Astronomical Society.
Copyright ©
2026 Astronomy Image Explorer. All Rights Reserved.