Image Details
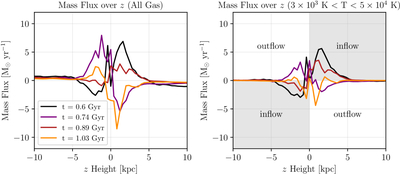
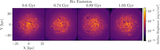
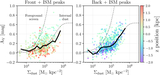
Caption: Figure 3.
Left: the mass flux of different slices of the galaxy at different z-positions above and below the disk. Four different snapshots of time are shown. Right: the same, but only for Hα-emitting gas between 3 × 10³ K and 5 × 10⁴ K. Regions of the plot corresponding to inflow and outflow are displayed in the right panel.
Other Images in This Article

Copyright and Terms & Conditions
© 2026. The Author(s). Published by the American Astronomical Society.
Copyright ©
2026 Astronomy Image Explorer. All Rights Reserved.