Image Details
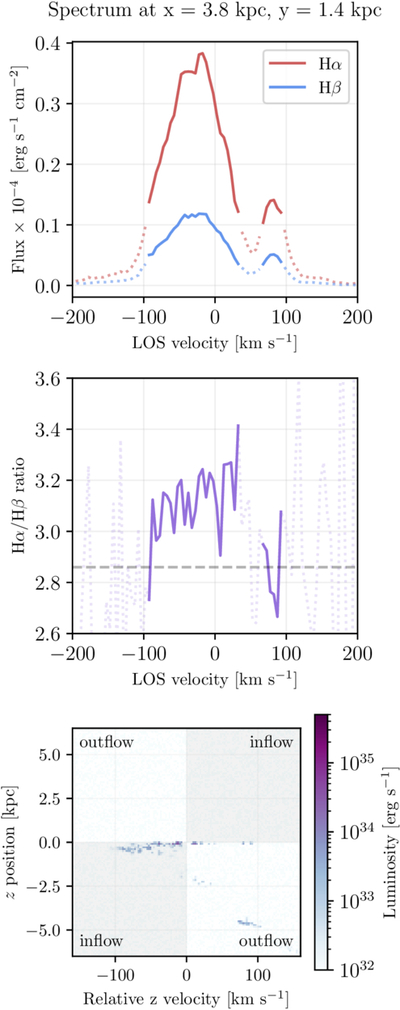
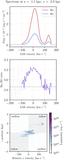
Caption: Figure 9.
Top: Hα and Hβ spectra of a single sightline ∼3.1 kpc from the center of the galaxy in the earliest time step. Dotted lines are regions below the flux limit, which were left out of the analysis, while solid lines are areas above the flux limit. Center: the Balmer decrement across the spectrum, with dotted lines again representing areas excluded from remaining analysis. The dashed gray line indicates the intrinsic Balmer decrement assuming Case B recombination and no dust. Bottom: a 2D histogram of the positions and velocities of particles in the sightline, weighted by luminosity. The displayed velocities are relative to the observer (not relative to the galaxy), so the sign of the velocity matches the spectra above.
Other Images in This Article

Copyright and Terms & Conditions
© 2026. The Author(s). Published by the American Astronomical Society.