Image Details
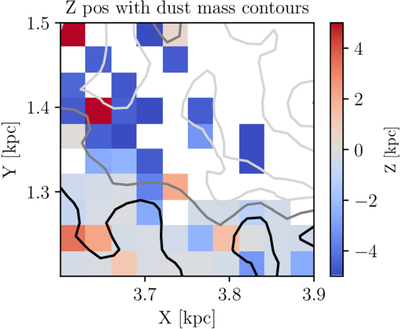
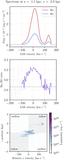
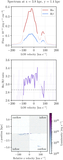
Caption: Figure 10.
This is a zoom-in on a single sightline whose spectrum is displayed in Figure 9. All pixels displayed fall within the same sightline. The colormap shows the z-position of the brightest emitting particles. The overlaid contours show the dust distribution, with the darkest contour denoting 1.2 × 10⁴ M⊙ kpc−2, the middle contour 6 × 10³ M⊙ kpc−2, and the lightest contour 2 × 10³M⊙ kpc−2.
Other Images in This Article

Copyright and Terms & Conditions
© 2026. The Author(s). Published by the American Astronomical Society.
Copyright ©
2026 Astronomy Image Explorer. All Rights Reserved.