Image Details
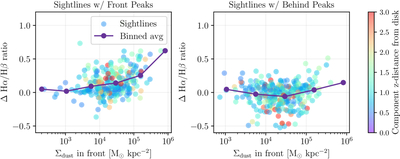
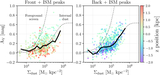
Caption: Figure 7.
On the left, each point represents a sightline containing a peak from the disk and one from in front of the disk. The x-axis is the dust surface density including only the dust along the sightline between the two components, and the y-axis shows the Hα/Hβ ratio of the front component subtracted from the Hα/Hβ ratio of the disk component. On the right, the plot is the same, but for sightlines containing peaks behind the disk. The y-axis is the ratio of the disk component subtracted from the ratio of the behind component. On each plot, the purple lines and dots display the average in different dust mass bins, to make the trend (on the left) or lack of trend (on the right) visually clearer.
Other Images in This Article

Copyright and Terms & Conditions
© 2026. The Author(s). Published by the American Astronomical Society.