Image Details
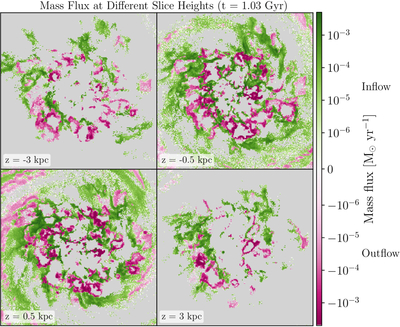
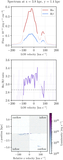
Caption: Figure 4.
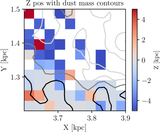
All panels show colormaps of the mass flux of gas at temperatures between 3 × 10³ and 5 × 10⁴ K across a slice of the galaxy with slice height labeled on the bottom right. Green corresponds to inflow, and pink corresponds to outflow. Gray regions show pixels where there are no warm gas particles.
Other Images in This Article

Copyright and Terms & Conditions
© 2026. The Author(s). Published by the American Astronomical Society.
Copyright ©
2026 Astronomy Image Explorer. All Rights Reserved.