Image Details
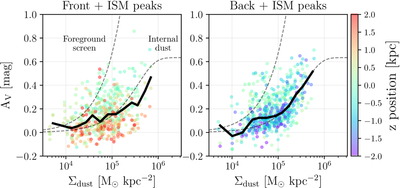
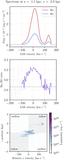
Caption: Figure 8.
The dust extinction in the visual band AV in magnitudes plotted against the surface density of dust Σdust. Each point represents a peak from one of the spectra, colored by their z-position with respect to the disk. The solid black lines are running medians of the displayed points. The dashed gray lines represent theoretical curves of the “foreground dust screen” and “internal dust” models from D. Calzetti et al. (1994) (see text for further explanation). The left side includes peaks from sightlines with front and ISM components, and the right side has peaks from sightlines with back and ISM components.
Other Images in This Article

Copyright and Terms & Conditions
© 2026. The Author(s). Published by the American Astronomical Society.