Image Details
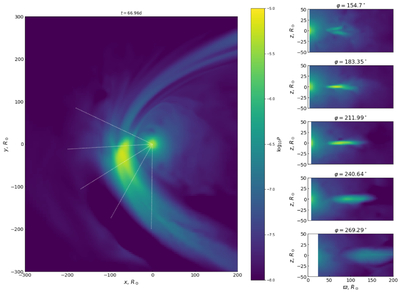
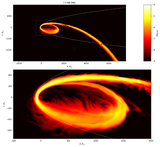
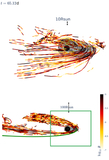
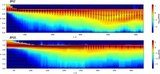
Caption: Figure 7.
Pressure distribution in the equatorial plane (left panel) and in several meridional planes (right panels; the corresponding cross sections are shown in the left panel with dotted white lines) covering the region of the pericenter and the nozzle shock. The color scale is logarithmic and identical in all the cross sections. The simulation stage is BH 2L, t ≃ 67 days. The right panels use a cylindrical radial coordinate ﹩\varpi =\sqrt{{x}^{2}+{y}^{2}}﹩.
Other Images in This Article
Show More
Copyright and Terms & Conditions
© 2026. The Author(s). Published by the American Astronomical Society.
Copyright ©
2026 Astronomy Image Explorer. All Rights Reserved.