Image Details
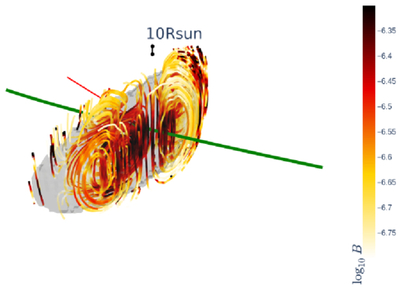
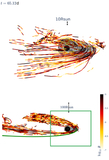
Caption: Figure 5.
Three-dimensional rendering of the field lines at t = 2.4 days, i.e., stage S2. Color shows the field strength logarithm (code units), while gray contours outline the region where s = 1/2. The camera is set at an elevation of 60 deg, along the negative direction of the Y-axis. The orbit is shown with a solid green line. The straight red line is directed toward the black hole. The scale is shown by a 10 R⊙ segment in the upper part of the picture.
Other Images in This Article
Show More
Copyright and Terms & Conditions
© 2026. The Author(s). Published by the American Astronomical Society.
Copyright ©
2026 Astronomy Image Explorer. All Rights Reserved.