Image Details
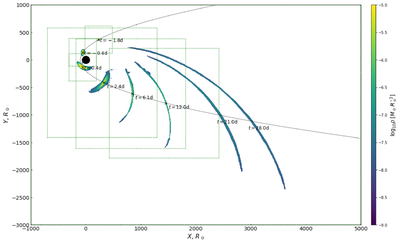
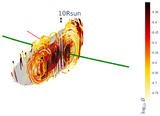
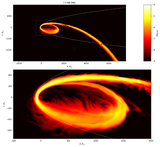
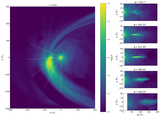
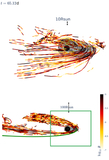
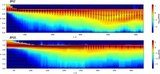
Caption: Figure 2.
Multi-exposure plot showing the evolution of the stellar debris from the initial hydrostatic configuration toward the fallback. Each image is a snapshot of the density (log-scale) in the equatorial plane, cut off at the level of ﹩1{0}^{-8}\,{M}_{\odot }\,{R}_{\odot }^{-3}﹩. The first three frames are from stage S1, the following three are from S2, and the last two are from BH 1. Green dotted rectangles are the boundaries of the simulation boxes. The boundaries of the plot coincide with the boundaries of the BH-frame simulation domain.
Other Images in This Article
Show More
Copyright and Terms & Conditions
© 2026. The Author(s). Published by the American Astronomical Society.
Copyright ©
2026 Astronomy Image Explorer. All Rights Reserved.