Image Details
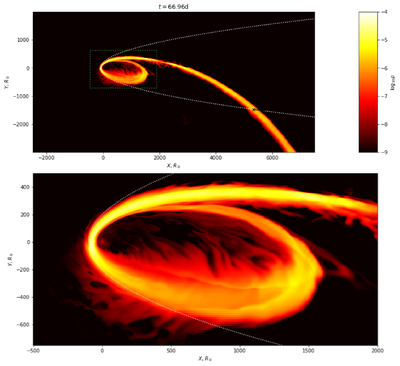
Caption: Figure 6.
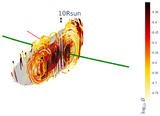
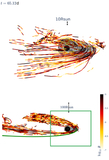
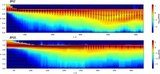
Equatorial-plane density map for t ≃ 67 days, for simulation BH 2L. The upper panel shows the whole frame, and the lower panel is a magnification of the region around the black hole (shown with a dotted green rectangle in the upper panel). The initial orbit is shown with a dotted white line. For the development of the density distribution with time, see the animation on YouTube (https://youtu.be/DmWdy8LakR8) and in the online Journal. The animation shows the density logarithm (﹩{M}_{\odot }/{R}_{\odot }^{3}﹩ units) evolution in the equatorial plane (simulation BH 2L). As in the static version, the white dotted line shows the initial parabolic orbit of the star.
(An animation of this figure is available in the online article.)
(An animation of this figure is available.)
The video/animation of this figure is available in the online journal.
Other Images in This Article
Show More
Copyright and Terms & Conditions
© 2026. The Author(s). Published by the American Astronomical Society.