Image Details
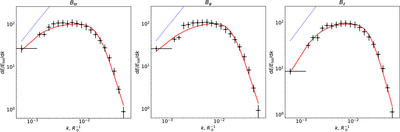
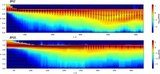
Caption: Figure 15.
PDSs of the three magnetic field components, Bϖ, Bφ, and Bz, averaged over 50 frames of the BHz simulation. The vertical error bars show the rms variation within the bin and between the frames. Solid red lines show the best fits with the empirical Equation (22). The dotted blue lines show Kazantsev’s power-law scaling ∝k3/2 with identical (arbitrary) normalization.
Other Images in This Article
Show More
Copyright and Terms & Conditions
© 2026. The Author(s). Published by the American Astronomical Society.
Copyright ©
2026 Astronomy Image Explorer. All Rights Reserved.