Image Details
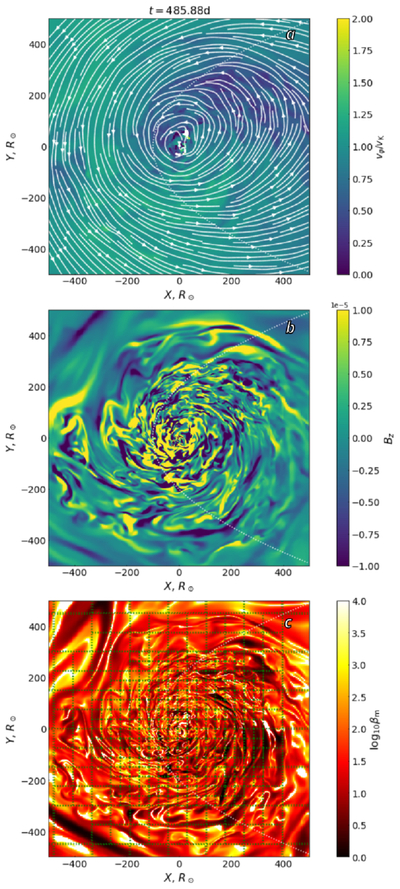
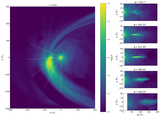
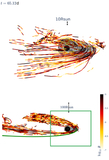
Caption: Figure 13.
Simulation BHz at t ≃ 485 days. Panels show equatorial cross sections of rotation velocity in Keplerian units (a), vertical magnetic field (b), and βm (c). In panel (a), velocity stream lines are overplotted with solid white lines. Dotted green lines in panel (c) are the boundaries of mesh blocks. Dotted white lines show the initial orbit.
Other Images in This Article
Show More
Copyright and Terms & Conditions
© 2026. The Author(s). Published by the American Astronomical Society.
Copyright ©
2026 Astronomy Image Explorer. All Rights Reserved.