Image Details
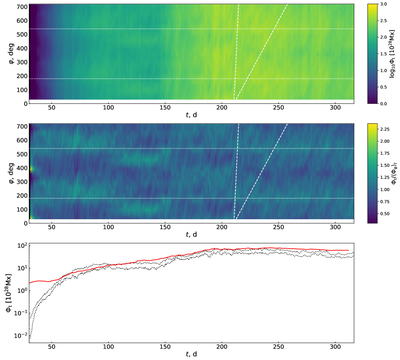
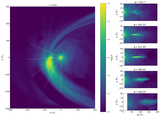
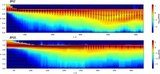
Caption: Figure 12.
One-sided toroidal magnetic flux throughout BH 2 as a function of φ and time. The upper panel shows the absolute flux values, the middle panel shows the fluxes normalized by the azimuth-averaged value, and the lower panel shows the maximal and minimal Φt (dotted black lines) compared to the vertical flux Φz indicated with a solid red line. Dashed white lines in the upper two panels correspond to rotation at a rate ﹩{{\rm{\Omega }}}_{{\rm{K}}}({r}_{{\rm{p}}})=\sqrt{GM/{r}_{{\rm{p}}}^{3}}﹩ and ΩK(500 R⊙). White dotted lines highlight the azimuth of the pericenter.
Other Images in This Article
Show More
Copyright and Terms & Conditions
© 2026. The Author(s). Published by the American Astronomical Society.
Copyright ©
2026 Astronomy Image Explorer. All Rights Reserved.