Image Details
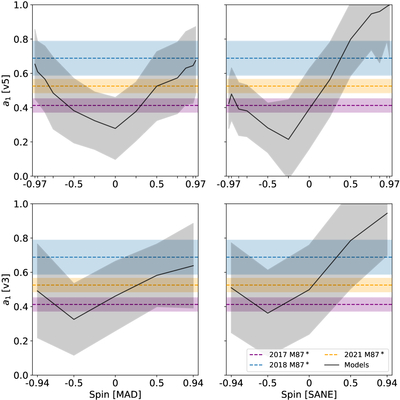
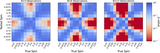
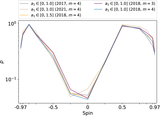
Caption: Figure 9.
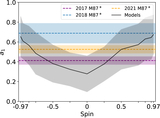
Asymmetry curves with 1σ ranges, as in Figure 5, for v5 MAD (top left), v5 SANE (top right), v3 MAD (bottom left), and v3 SANE (bottom right) models. The black lines show the modes μ of truncated Gaussians fitted to modeled asymmetry distributions at each spin. The gray bands show the 1σ variation of the distributions. Observed asymmetries in M87* are marked with dashed lines. The colored bands show 1σ uncertainties. X-axis tick marks show the spins sampled in each set of models.
Other Images in This Article
Copyright and Terms & Conditions
© 2026. The Author(s). Published by the American Astronomical Society.
Copyright ©
2026 Astronomy Image Explorer. All Rights Reserved.