Image Details
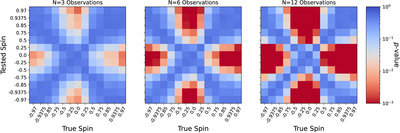
Caption: Figure 8.
Effect of new observations on spin constraints. We repeatedly “observe” N random asymmetry samples from the MAD model distribution for each “true” spin, then compare the mock observations to the asymmetry distribution for each “tested” spin using a KS test. The resulting median probability p of each tested spin is shown for N = 3 observations (left), N = 6 (center), and N = 12 (right). High p (blue) suggests the asymmetry distribution in the tested spin is a good match to the observations of the true spin; low p (red) suggests we can rule out the tested spin. As N increases, we can correctly rule out an increasing fraction of the parameter space.
Other Images in This Article
Copyright and Terms & Conditions
© 2026. The Author(s). Published by the American Astronomical Society.