Image Details
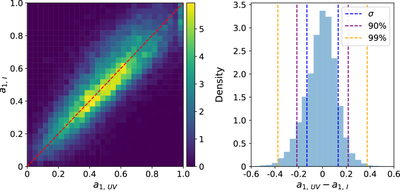
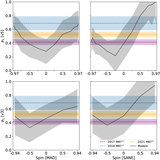
Caption: Figure 3.
Comparison of the asymmetry magnitude measured in the image domain a1,I and (u, v) domain a1,UV for MAD models, plotted as the density of total snapshots. Left: the distribution of snapshots in (a1,I, a1,UV) space. The red line corresponding to a1,I = a1,UV. We set a ceiling of a1,UV ≤ 1 in the (u, v) optimizer, which accounts for the cluster of snapshots at a1,UV = 1. These outlier values occur in <1% of total snapshots and do not affect our results (see Appendix B). Right: distribution of a1,UV − a1,I, with 1σ, 90%, and 99% boundaries marked. Nearly 90% of snapshots have ∣a1,UV − a1,I∣ < 0.2.
Other Images in This Article
Copyright and Terms & Conditions
© 2026. The Author(s). Published by the American Astronomical Society.
Copyright ©
2026 Astronomy Image Explorer. All Rights Reserved.