Image Details
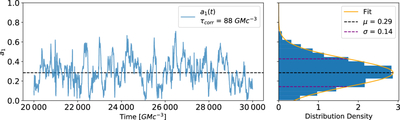
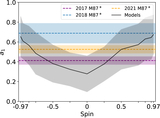
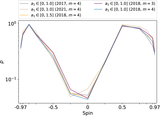
Caption: Figure 4.
Left: evolution of asymmetry a1 in time, over a 10,000 tg time window, for the a* = 0, Rlow = 1, Rhigh = 40, MAD model. Right: the distribution of asymmetry amplitudes for this model window. The truncated Gaussian fit to the distribution is shown, with the mode μ = 0.29 and standard deviation σ = 0.14.
Other Images in This Article
Copyright and Terms & Conditions
© 2026. The Author(s). Published by the American Astronomical Society.
Copyright ©
2026 Astronomy Image Explorer. All Rights Reserved.