Image Details
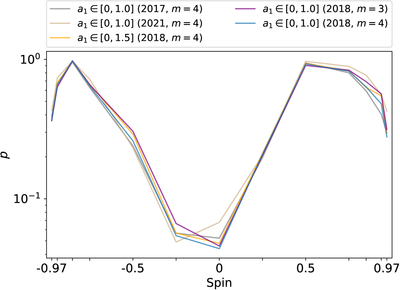
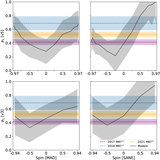
Caption: Figure 10.
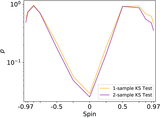
Same as Figure 6, but now showing the probability p across spin for the two-sample KS test using different modeling methodologies. We replot the curve of Figure 6 (blue), adjust the assumed (u, v) coverage from 2018 to 2017 (gray) and 2021 (tan), adjust the Comrade template to allow a maximum asymmetry of ﹩{a}_{1\,{\rm{\max }}}=1.5﹩ (orange), and adjust the Comrade template to use an m = 3 m-ring (purple). The results are largely consistent, producing lower p-values for zero-spin models.
Other Images in This Article
Copyright and Terms & Conditions
© 2026. The Author(s). Published by the American Astronomical Society.
Copyright ©
2026 Astronomy Image Explorer. All Rights Reserved.