Image Details
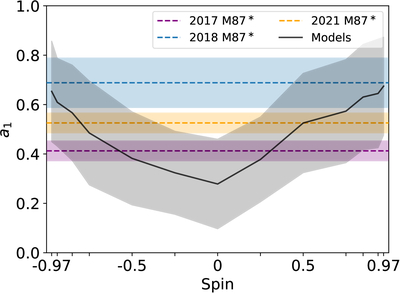
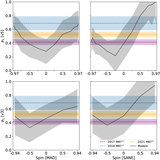
Caption: Figure 5.
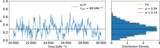
Distribution of MAD model asymmetry. The black line shows the modes μ of truncated Gaussians fitted to modeled asymmetry distributions, marginalizing over Rhigh and Rlow, at each spin. The gray band shows 1σ distribution variation. EHT measurements of asymmetry in M87* are shown as dashed lines, surrounded by 1σ regions (colored shaded bands). Spin values present in the models are shown with x-axis tick marks. The 2017, 2018, and 2021 data fall above the 50th percentile for zero-spin models. The 2018 asymmetry falls above the 90th percentile for zero-spin models.
Other Images in This Article
Copyright and Terms & Conditions
© 2026. The Author(s). Published by the American Astronomical Society.
Copyright ©
2026 Astronomy Image Explorer. All Rights Reserved.