Image Details
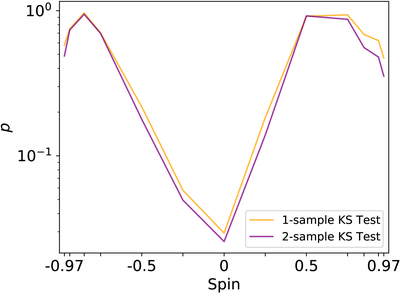
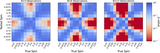
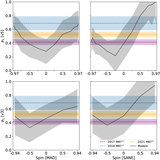
Caption: Figure 6.
Probability p that the ensemble of MAD models at fixed spin is consistent with EHT data. The purple curve shows the results from the two-sample KS test against the full asymmetry distributions obtained for each spin. The yellow curve shows one-sample KS tests, with underlying asymmetry distributions replaced with best-fit truncated normal distributions. Parameters of these distributions are given in Table 2. The results are largely consistent.
Other Images in This Article
Copyright and Terms & Conditions
© 2026. The Author(s). Published by the American Astronomical Society.
Copyright ©
2026 Astronomy Image Explorer. All Rights Reserved.