Image Details
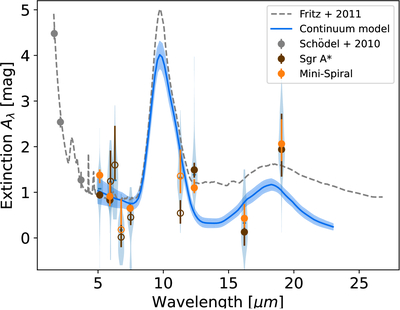
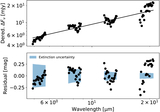
Caption: Figure 9.
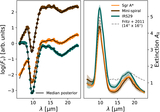
Best overall MIR extinction law. The blue curve shows the continuum extinction shifted by −0.18 ± 0.02 mag to match the line-derived extinction values (filled brown and orange points). The continuum model is the average of the Sgr A* and Mini-spiral model. The fit excludes the four lines most affected by residual fringing: 5.957, 6.292, 6.772, and 11.309 μm, indicated by open points. The gray dashed line shows the extinction law derived by T. K. Fritz et al. (2011), and gray points show the stellar-color-based extinction law by R. Schödel et al. (2010). The relative extinction measurements were calibrated using A7.46 = 0.64 mag. Violin plots show the spread of values using the pixel-by-pixel extinction measurements; the brown and orange points show the measurements for two apertures centered on Sgr A* and the Mini-spiral shown in Figure 7. The data behind this figure, including the median posterior model and posterior samples, are available.
(The data used to create this figure are available in the online article.)
(The data used to create this figure are available.)
Other Images in This Article
Copyright and Terms & Conditions
© 2025. The Author(s). Published by the American Astronomical Society.