Image Details
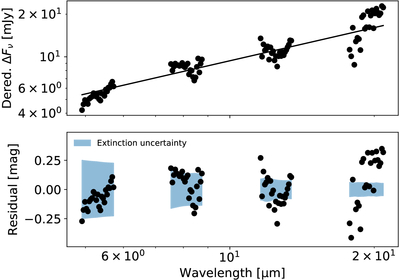
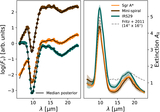
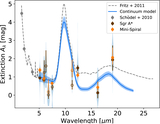
Caption: Figure 10.
Extinction correction applied to a bright state of Sgr A*. The top panel shows a power-law fit to the differential flux measurements, and the bottom panel shows the deviations from a power law. The blue areas indicate the extinction uncertainty derived from the dust continuum modeling. The data were first presented by S. D. von Fellenberg et al. (2025), and J. Michail et al. (2025) gave a detailed analysis of the spectrum.
Other Images in This Article
Copyright and Terms & Conditions
© 2025. The Author(s). Published by the American Astronomical Society.
Copyright ©
2026 Astronomy Image Explorer. All Rights Reserved.