Image Details
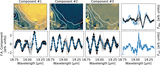
Caption: Figure 7.
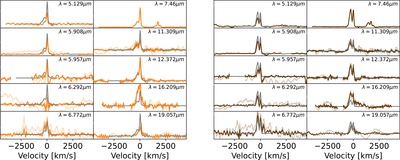
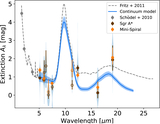
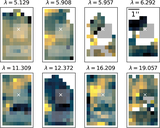
Hydrogen recombination line measurements for two apertures, centered on Sgr A* (left) and the Mini-spiral (right). The colored lines show the observed spectra after continuum subtraction and fringing correction, and the semitransparent lines show the spectra before the residual fringing correction. Each plot shows one of the lines with sufficient S/N (orange and brown lines). The gray line shows the λline = 7.46 μm recombination line profile scaled by the expected line ratio as given in Table 1. The respective apertures are shown in Figure 8.
Other Images in This Article
Copyright and Terms & Conditions
© 2025. The Author(s). Published by the American Astronomical Society.
Copyright ©
2026 Astronomy Image Explorer. All Rights Reserved.