Image Details
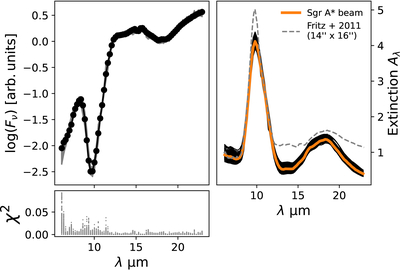
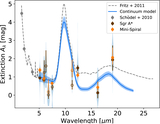
Caption: Figure 2.
Continuum model (top left) and extinction law (top right) derived from a fit to the spectrum in the Sgr A* pixel. The black line and dots show the binned spectrum with an artificially added 3% log-normally distributed uncertainty. The gray lines show posterior samples of the extincted dust model. The panel below shows the χ2 residual. The right plot shows the derived extinction curves (Aλ). The orange line shows the median posterior model, and the black line shows the posterior samples. The dashed gray line shows the extinction law derived by T. K. Fritz et al. (2011). That law is based on the ISO/SWS observations by D. Lutz et al. (1996), which had an effective beam size of 14″ × 16″.
Other Images in This Article
Copyright and Terms & Conditions
© 2025. The Author(s). Published by the American Astronomical Society.