Image Details
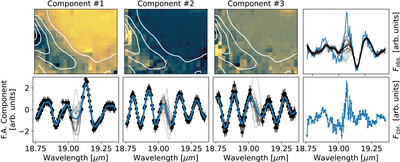
Caption: Figure 6.
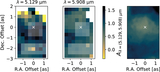
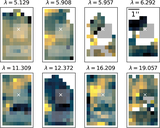
Example of defringing using the factor-analysis approach for the λ = 19.057 μm recombination line. The left three plots in the top row show the FA component fields with contour lines showing the channel 4 mean flux density. The left three plots in the bottom row show the respective FA basis functions, the mean posterior GP fit (blue line), and the posterior samples (gray lines). The rightmost two plots show the observed spectrum with the derived continuum model (top panel, black and gray lines show continuum models) and the corrected spectrum (bottom panel).
Other Images in This Article
Copyright and Terms & Conditions
© 2025. The Author(s). Published by the American Astronomical Society.
Copyright ©
2026 Astronomy Image Explorer. All Rights Reserved.