Image Details
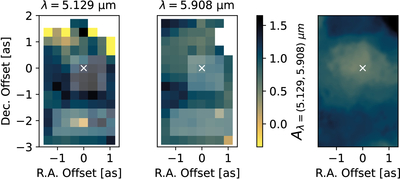
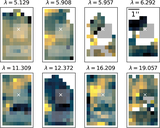
Caption: Figure 8.
Spatial variation of the line-derived extinction values for the 5.129 μm and 5.908 μm hydrogen recombination lines. The color bar shows the relative extinction measurements from the line ratios (A5.129/7.46 and A5.908/7.46) after they were converted to absolute extinction values by adding A7.46 = 0.64 mag derived from the Mini-spiral extinction measurement (Section 4.2). The white cross shows the approximate location of Sgr A*, and the lighter patches illustrate the two aperture masks used to obtain the line measurements in Figure 7. The rightmost panel shows the K-band extinction map derived from stellar colors (R. Schödel et al. 2010). The K band has higher absolute extinction (﹩{\left\langle A\right\rangle }_{2.16}\approx 2.4\,{\rm{mag}}﹩) but shows spatial variations similar to the MIR.
Other Images in This Article
Copyright and Terms & Conditions
© 2025. The Author(s). Published by the American Astronomical Society.