Image Details
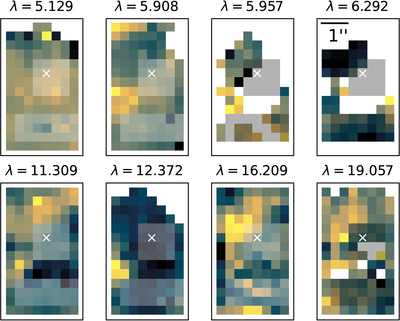
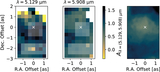
Caption: Figure 11.
Spatial variation of the line-derived extinction values for all lines with S/N > 6. Pixels with S/N < 6 are flagged. As in Figure 8, the white cross marks the Sgr A* position, and the lighter or gray patches indicate the two aperture areas where the lines were measured. Residual fringing may have affected the spatial correlation. (See text for details.) The color maps have different minima and maxima, but have been scaled to illustrate the spatial variations in the field. The white crosses mark the approximate location of Sgr A*.
Other Images in This Article
Copyright and Terms & Conditions
© 2025. The Author(s). Published by the American Astronomical Society.
Copyright ©
2026 Astronomy Image Explorer. All Rights Reserved.