Image Details
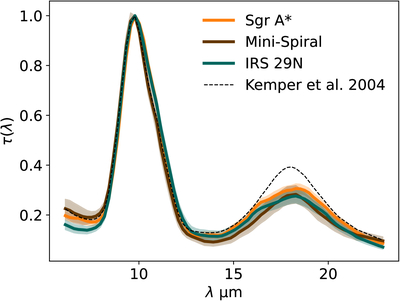
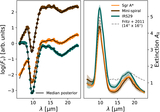
Caption: Figure 5.
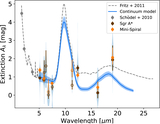
Posterior distribution of the optical depth law τ(λ) defined in Equation (1). Different colors show the optical depths for different regions. The dashed line shows the optical depth profile by F. Kemper et al. (2004), which serves as a prior model and from which we allowed a multiplicative deviation.
Other Images in This Article
Copyright and Terms & Conditions
© 2025. The Author(s). Published by the American Astronomical Society.
Copyright ©
2026 Astronomy Image Explorer. All Rights Reserved.