Image Details
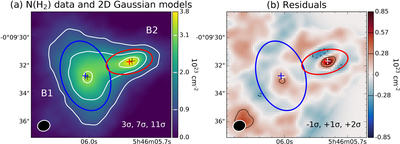
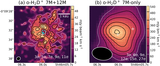
Caption: Figure D1.
Mass derivation of G205.46−14.56 M3 substructures B1 and B2 from our 820 μm data. (a) N(H2) map and contours from Figure 2(c) overlaid with 2D Gaussian models, where ellipses indicate the FWHMs of the major and minor axes. (b) Residuals between the observed data and the fitted models, with N(H2) contour levels at −1σ, 1σ, and 2σ, where σ = 2.8 × 1022 cm−2. Blue and red crosses mark the fitted Gaussian centers, while black/white crosses denote the 2D Gaussian centers derived from 1.3 mm data (Table 1 from D. Sahu et al. 2021).
Other Images in This Article
Copyright and Terms & Conditions
© 2025. The Author(s). Published by the American Astronomical Society.
Copyright ©
2026 Astronomy Image Explorer. All Rights Reserved.