Image Details
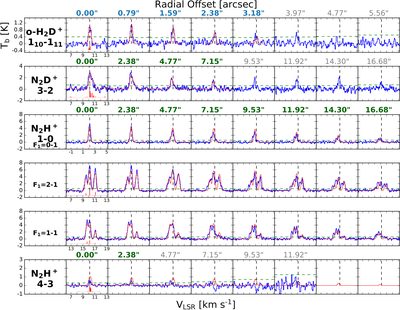
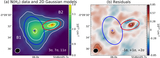
Caption: Figure 4.
Spectral observations along the southwest cut compared with the best-fit radiative transfer model. Blue spectra represent observational data, while red spectra show the models. Green dashed lines mark the 3σ noise level. Each row corresponds to a molecular line, with the N2H+ (1–0) line split into three rows for F1-hyperfine groups. Columns represent different offsets from the center of G205 M3 B1, marked by color-coded asterisks in Figure 1. Spectra at gray offsets are excluded from modeling due to nondetections or deviations from spherical geometry. Normalized HFS patterns are shown in red beneath each central spectrum. Black dashed lines indicate the systemic velocity of 10.151 km s−1. For N2H+ (1–0), additional black dashed lines highlight the F1, F = (0, 1–1, 2) and (1, 2–1, 2) components.
Other Images in This Article
Copyright and Terms & Conditions
© 2025. The Author(s). Published by the American Astronomical Society.