Image Details
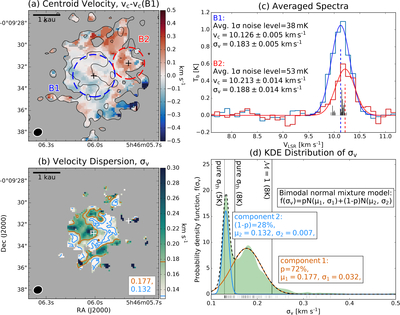
Caption: Figure 3.
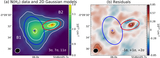
G205.46−14.56 M3 kinematics traced by ortho-H2D+. (a) Centroid velocity map, using data with ≥3σ detection on the integrated-intensity map (with the 3σ and 7σ contours overlaid; see Figure 1(b)). (b) Velocity dispersion map, only using data with ≥5σ detection at the spectral peaks. (c) Averaged spectra for B1 (blue) and B2 (red), extracted from the regions enclosed by the corresponding dashed circles in panel (a), with fitted Gaussian profiles and annotated parameters. The centroid velocity of B1 serves as the velocity reference in panel (a). The normalized o-H2D+ (110–111) HFS pattern is also shown in black beneath the B1 spectrum. (d) KDE distribution of velocity dispersions with a rug plot. The fitted bimodal model and its parameters are annotated, with the two dispersion peaks overlaid on panel (b) as contours. Vertical lines show the expected velocity dispersion including channel broadening for pure thermal cases and ﹩{ \mathcal M }=1﹩ cases assuming 5 K and/or 8 K (see Appendix C).
Other Images in This Article
Copyright and Terms & Conditions
© 2025. The Author(s). Published by the American Astronomical Society.