Image Details
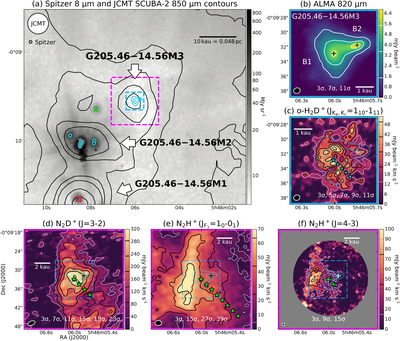
Caption: Figure 1.
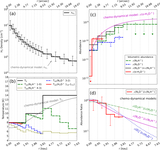
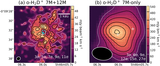
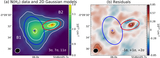
Multiscale view of the prestellar core G205.46−14.56 M3 in dust continuum and integrated molecular line emission. (a) Spitzer IRAC 8 μm image of the three JCMT dense cores G205.46−14.56 M1, M2, and M3 (S. Dutta et al. 2020). JCMT SCUBA-2 850 μm continuum contours overlaid at 10%–90% (20% steps) of the peak of the faintest prestellar core, G205 M3 (500 mJy beam−1), with additional contours at 1000 and 2000 mJy beam−1. Colored symbols mark protostars compiled by B. Reipurth et al. (2023): five cyan circles denote the Class 0/I multiple system SSV 63 hosted by M2, one red square marks the Class 0 source HOPS 317 embedded in M1, and the green triangle indicates the Class II source IRS 1. A cyan dashed box outlines the region enlarged in panels (b) and (c), and a magenta box encloses panels (d)–(f); these same borders are repeated around the zoom-in panels to guide the eye. (b) ALMA Band 7 820 μm continuum. (c) ALMA Band 7 ortho-H2D+ (110–111) map integrated over vLSR = 9.5–10.8 km s−1. (d) ALMA Band 6 N2D+ (3–2) map integrated over vLSR = 9.1–11.6 km s−1, where the Total-Power (TP) data are included to recover extended emission. (e) ALMA Band 3 N2H+ (1–0) isolated hyperfine component integrated over vLSR = 9.0–11.1 km s−1 and combined with TRAO single-dish data. (f) ALMA Band 7 N2H+ (4–3) map integrated over vLSR = 9.6–10.9 km s−1. ALMA emission contour levels are labeled in each panel; the 3σ contour is drawn in white to maximize contrast against the color scale, whereas higher levels are black for molecular lines. These 1σ levels are 0.5 mJy beam−1 in panel (b), and 4.5, 12, 1.6, and 5 mJy beam−1 km s−1 in panels (c)–(f), respectively. Contours from panel (b) are overlaid on all other panels for reference. Crosses denote the substructures B1 and B2 (D. Sahu et al. 2021), asterisks mark positions adopted for the non-LTE radiative-transfer analysis (Section 4.3). Beam sizes and scale bars are indicated in each panel. We note that the ALMA color images are primary-beam corrected, whereas contours are drawn from uncorrected images with uniform noise.
Other Images in This Article
Copyright and Terms & Conditions
© 2025. The Author(s). Published by the American Astronomical Society.