Image Details
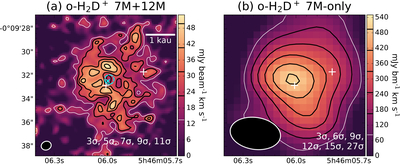
Caption: Figure 6.
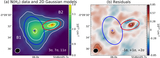
Comparison of the ALMA 7 m+12 m combined map and the 7 m-only map of o-H2D+ (110–111). (a) 7 m+12 m combined integrated-intensity map, identical to Figure 1(c). The dashed cyan circle marks the circularized Band 7 beam (0﹩\mathop{.}\limits^{^{\prime\prime} }﹩79) and approximates the FWHD of the depletion zone, while the cyan “×” marks the intensity minimum. (b) 7 m-only integrated-intensity map over the same velocity range as (a), with synthesized beam of ﹩4\mathop{.}\limits^{^{\prime\prime} }30\times 2\mathop{.}\limits^{^{\prime\prime} }72﹩ (P.A. ﹩=81\mathop{.}\limits^{^\circ }7﹩), and the 1σ rms of 27 mJy beam−1 km s−1. To maximize contrast with the color scale, the 3σ o-H2D+ contour is drawn in white, while higher contours are black. Beam sizes, contour levels, and crosses marking B1 and B2 are indicated in each panel. Color images are primary-beam-corrected, whereas contours are drawn from primary-beam-uncorrected images to preserve uniform noise.
Other Images in This Article
Copyright and Terms & Conditions
© 2025. The Author(s). Published by the American Astronomical Society.