Image Details
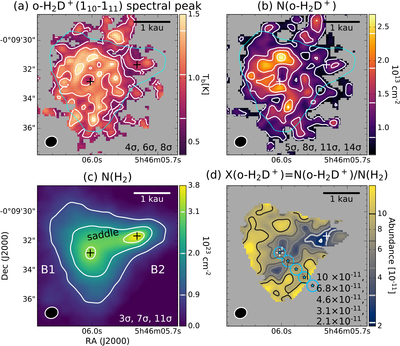
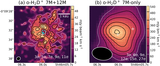
Caption: Figure 2.
Ortho-H2D+ column density analysis assuming LTE with Tex = 8 K. Calculations are limited to regions with ortho-H2D+ (110–111) integrated intensities of S/N > 3. (a) Spectral peak map overlaid with contour levels at 4σ, 6σ, and 8σ, where 1σ = 0.17 K. These ﹩{T}_{{\rm{b}}}﹩ contour levels correspond to optical depths, ﹩{\tau }_{\nu }﹩, of the order of 0.4, 0.7, and 1.0. (b) o-H2D+ column density map, N(o-H2D+), overlaid with contour levels at 5σ, 8σ, 11σ, and 14σ, where σ = 1.7 × 1012 cm-2. (c) Molecular hydrogen column density map, N(H2), derived from dust continuum emission assuming Tdust = 8 K. Contour levels are at 3σ, 7σ, and 11σ, corresponding to 8.5 × 10²², 2.0 × 10²³, and 3.1 × 1023 cm−2, with σ = 2.8 × 1022 cm−2. (d) Column abundance map, X(o-H2D+) = N(o-H2D+)/N(H2), masked at the cyan N(H2) 3σ contour, with logarithmically spaced X(o-H2D+) contour levels annotated on the panel. Crosses mark the substructures B1 and B2, and cyan asterisks/circles indicate positions used for non-LTE radiative transfer modeling (Section 4.3). Beam sizes and spatial scales are shown in the bottom left and top right corners, respectively.
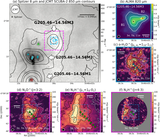
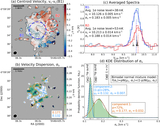
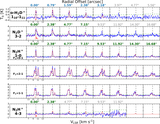
Other Images in This Article
Copyright and Terms & Conditions
© 2025. The Author(s). Published by the American Astronomical Society.