Image Details
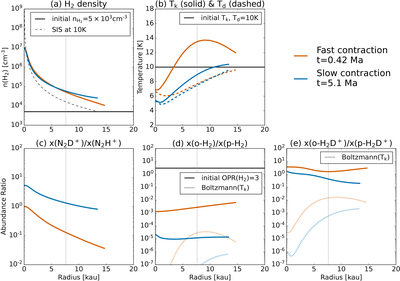
Caption: Figure 7.
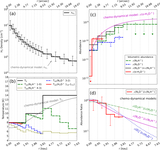
Comparison of fast and slow-contraction chemodynamical models. (a) H2 number density, ﹩{n}_{{{\rm{H}}}_{2}}﹩. (b) Gas kinetic temperature, Tk (solid), and dust temperature, Td (dashed). (c) Deuteration ratio, x(N2D+)/x(N2H+). (d) Ortho-to-para ratio of H2, OPR(H2). (e) Ortho-to-para ratio of H2D+, OPR(H2D+). Orange and blue curves correspond to snapshots at t = 0.42 Ma (fast) and t = 5.1 Ma (slow), respectively, chosen when both reach a central density of ﹩{n}_{{{\rm{H}}}_{2}}(0)=1.1\times 1{0}^{7}﹩ cm−3. The initial uniform density 5 × 103 cm−3, a 10 K singular isothermal sphere (SIS) reference, the initial Tk = Td = 10 K, and the initial OPR(H2) = 3 are indicated. Boltzmann OPR(H2) and OPR(H2D+) corresponding to the Tk profile are noted. The dotted vertical line marks the outer boundary used in the non-LTE radiative-transfer modeling (7.63 kau).
Other Images in This Article
Copyright and Terms & Conditions
© 2025. The Author(s). Published by the American Astronomical Society.