Image Details
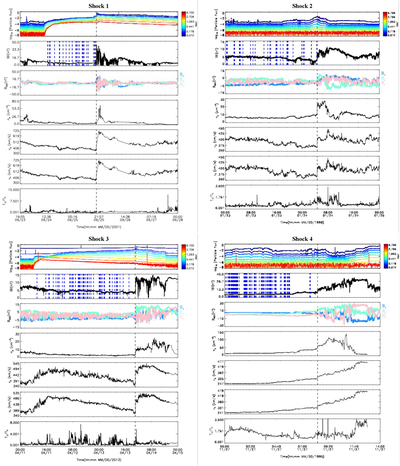
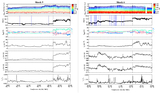
Caption: Figure 9.
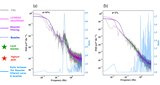
Plasma parameters for the upstream and downstream regions of all six shocks analyzed in this study are shown. Each plot is labeled with the corresponding shock number as listed in Table 1. The vertical black dashed line in each plot denotes the shock arrival time. For each shock, the top panel displays the particle flux of various energetic particles (from 72 keV to 6.7 MeV) near the shock occurrence, followed by parameters such as the magnitude of the magnetic field (∣B∣), the three components of the magnetic field in the GSE coordinate system (Bx, By, Bz), solar wind particle density (np), bulk proton velocity (Vp), bulk α particle velocity (Vα), and the evolution of temperature anisotropy (T⊥/T∥) around the time of the shock arrival. The blue dashed lines in the total magnetic field panel mark the time intervals of PSD peaks.
Other Images in This Article

Copyright and Terms & Conditions
© 2025. The Author(s). Published by the American Astronomical Society.