Image Details
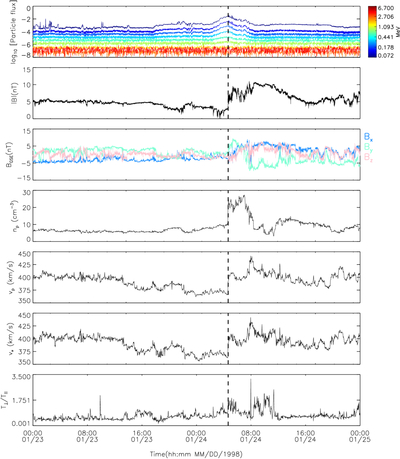
Caption: Figure 1.
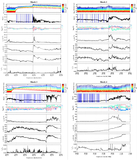
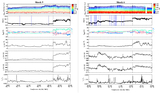
A typical shock chosen from Table 1, identified as shock 2. The vertical dashed line denotes the arrival time of the shock. The upper plot displays the particle flux of various energetic particles (from 72 keV to 6.7 MeV) near the shock occurrence. Parameters such as the magnitude of the magnetic field (∣B∣), the three components of the magnetic field (Bx, By, Bz), particle density (np), bulk proton velocity (Vp), bulk α particle velocity (Vα), and the evolution of temperature anisotropy (T⊥/T∥) are graphically represented around the time of the shock arrival.
Other Images in This Article

Copyright and Terms & Conditions
© 2025. The Author(s). Published by the American Astronomical Society.
Copyright ©
2025 Astronomy Image Explorer. All Rights Reserved.