Image Details
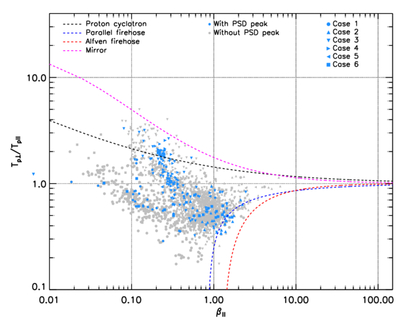
Caption: Figure 4.
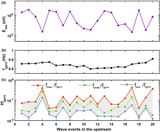
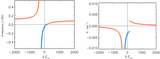
Scatterplot illustrating the data distribution in the proton temperature anisotropy ratio and plasma β∣∣ plane. Data points with and without PSD peaks are indicated by gray and blue points, respectively. The overlaid curves are thresholds for the proton cyclotron (black), parallel firehose (blue), Alfvén firehose (red), and mirror (magenta) instabilities. As shown in the plot, some of the data points with PSD peaks hint toward possible activation of proton-cyclotron and parallel firehose instabilities.
Other Images in This Article

Copyright and Terms & Conditions
© 2025. The Author(s). Published by the American Astronomical Society.
Copyright ©
2025 Astronomy Image Explorer. All Rights Reserved.