Image Details
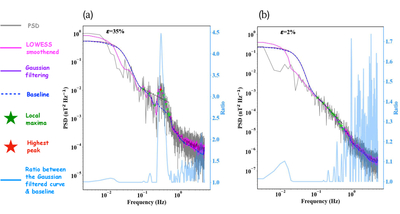
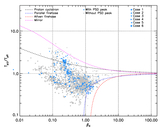
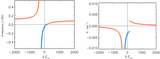
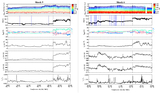
Caption: Figure 8.
Examples illustrating the functionality of the peak detection algorithm. In the left PSD, a peak is identified by the algorithm as the deviation from a true power law, quantified by ϵ, exceeding the threshold value of ϵth = 13%. Conversely, the PSD on the right shows no enhancement or peak, with a very small ϵ value, confirming that the power spectrum closely follows a power law.
Other Images in This Article

Copyright and Terms & Conditions
© 2025. The Author(s). Published by the American Astronomical Society.
Copyright ©
2025 Astronomy Image Explorer. All Rights Reserved.