Image Details
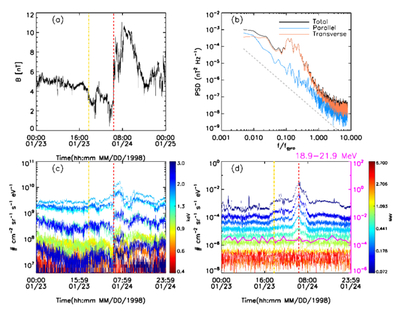
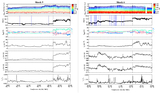
Caption: Figure 2.
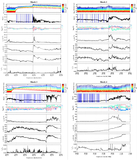
Parameters depicting the presence of unstable modes in the shock upstream. The vertical red dashed lines in each plot indicate the location of the shock. (a) The magnitude of the magnetic field around the shock. (b) Magnetic power spectral density (PSD) showing the peak, attributed to the transverse component of the magnetic field. PSD is computed over a 5 minute time window at the time marked with the yellow vertical line in the time series plots. The gray dotted line shows the Kolmogorov spectrum with slope −5/3. (c) Time series data of the low-energy particles (0.4–3 keV). (d) Time series data of the highly energetic particles (72 keV–21.9 MeV).
Other Images in This Article

Copyright and Terms & Conditions
© 2025. The Author(s). Published by the American Astronomical Society.